Source: World Bank, cover picture for Changing Wealth of
Nations: Technical Reports
Source: World Bank, cover picture for Changing Wealth of
Nations: Technical Reports
This article is part of a series on integrating the value of nature in economic and financial decision making. It is targeted to data users looking for technical guidance on how to use these datasets and tools. Here, we unpack the latest innovation in the Changing Wealth of Nations (CWON) 2024, and why it matters for sustainability and policy. In an earlier post we introduced the concept of wealth accounting and in Part 2 we explore an application to the development of natural capital in Sub-Saharan Africa. Like the Sovereign ESG Data Portal, the Changing Wealth of Nations is supported by the Global Program on Sustainability , which promotes the use of high-quality data and analysis on natural capital, ecosystem services and sustainability to better inform decisions made by governments, the private sector, and financial institutions.
The case for measuring all components of wealth
“What gets measured gets managed.” But are we measuring the right things? For decades, GDP has been the primary lens for assessing economic progress. Yet GDP does not tell us whether growth today comes at the expense of tomorrow's well-being and sustainable resource use. “Over half of global GDP ($58 trillion of economic activity in 2023) is generated in sectors that are moderately to highly dependent on nature” ( IPBES ,2024 ). But, if we are not measuring nature, how do we know if we undermine our future by overexploiting natural resources?
The Changing Wealth of Nations 2024 (CWON 2024) presents a revised approach to assess economic progress by tracking the assets that underpin future well-being: produced, human, and natural capital. With a major methodological innovation in the measurement of real wealth, CWON 2024 enables better measurement of sustainability and intergenerational equity. When combined with ESG data, this framework can make sure that nature and human capital are valued appropriately in economic policy and financial decision-making.
How does CWON 2024 improve the measurement of sustainability?
There is a well-established literature in economics that argues that the change in real wealth is a good indicator of sustainability. Specifically, a necessary condition for sustainable development is non-declining real wealth, as it reflects the production and subsequent consumption opportunities passed on to future generations relative to those of the current generation. As the United Nations Brundtland Commision defined it in 1987 , sustainable development means to “meet the needs of the present without compromising the ability of future generations to meet their own needs” .
The 2024 edition of The Changing Wealth of Nations introduces a key methodological innovation: the use of a chained Törnqvist volume index to compute real wealth estimates. This replaces the previous practice of deflating nominal wealth using the GDP implicit price deflator and enables clearer tracking of whether countries are building or depleting the assets that underpin their economic growth. The new approach better reflects the sustainability of production capacities by weighting assets' physical volumes according to their economic importance (their share of total wealth).
The Törnqvist volume index calculates changes in real wealth by multiplying the year-over-year changes in physical volumes across different assets, weighted by each assets' monetary value.
$$ \text{Törn}_t = \prod_{a=1}^{k} \left( \frac{q_{a,t}}{q_{a,t-1}} \right)^{\theta_{a,t}} \quad \text{where} \quad \theta_{a,t} = \frac{1}{2} [s_{a,t} + s_{a,t-1}] = \frac{1}{2} \left[ \frac{w_{a,t}^{q}}{\sum w_{i,t}^{q}} + \frac{w_{a,t-1}^{q}}{\sum w_{i,t-1}^{q}} \right] $$In the equation above:
- \(q_{a,t}\) is the physical volume of asset a in year t,
- \(s_{a,t}\) is the share of asset a in the nominal value of all assets \(\{1, 2, \ldots, k\}\) included in the index in year t, defined as \(s_{a,t} = \frac{w_{a,t}^{n}}{w_{t}^{n}}\),
- \(w_{t}^{n}\) is the nominal value of all assets \(\{1, 2, \ldots, k\}\) included in the index in year t, defined as \(w_{t}^{n} = \sum_{a=1}^{k} w_{a,t}^{n}\), where \(w_{a,t}^{n}\) is the nominal value of asset a in year t,
- \(\theta_{a,t}\) is the weight of asset a in year t, which is the arithmetic average of the shares of asset a in the nominal value of all assets \(\{1, 2, \ldots, k\}\) included in the index in period t and t-1, defined as \(\theta_{a,t} = \frac{1}{2} \left[\frac{w_{a,t}^n}{w_{t}^n} + \frac{w_{a,t-1}^n}{\sum w_{t-1}^n} \right]\).
This innovation allows to isolate real changes in wealth arising from asset accumulation, depletion, or shifts in productivity reflected in relative prices, rather than price fluctuations alone. For more details about the use of the Törnqvist volume index in the CWON data, take a look at Section 2 of the main report or the methodology document.
The new Törnqvist-based real wealth measure enables better tracking of sustainability by capturing a range of assets.
| Asset Category | Sub-components | Physical Volume |
|---|---|---|
| Produced Capital | Produced Capital | Capital stock and urban land area |
| Human Capital | Male Human Capital | Male labor force |
| Female Human Capital | Female labor force | |
| Renewable Natural Capital | Agricultural Land | Crop and pastureland area |
| Timber | Productive forest area | |
| Mangroves | Mangroves area | |
| Forest recreation, hunting and fishing | Accessible forest and non-wood products area | |
| Non-Wood Forest Protection services | Accessible forest and non-wood products area | |
| Forest water services | Accessible forest and non-wood products area | |
| Fisheries | Fish biomass | |
| Hydropower | Electricity generation | |
| Nonrenewable Natural Capital | Oil | Oil reserves |
| Natural Gas | Gas reserves | |
| Coal | Coal reserves | |
| Metals and Minerals | Mineral reserves |
Why the Revised CWON 2024 Methodology Matters
The CWON 2024 methodology represents a major shift in how we measure real wealth, moving the focus from the sustainability of consumption to the sustainability of production. Traditional wealth metrics often centered on whether countries could maintain future consumption, which could obscure unsustainable asset depletion — especially when rising prices mask declining quantities.
In contrast, the new approach captures real changes in asset volumes—such as land, forests, and minerals—by weighting these changes based on each asset's economic significance. This ensures that wealth accounting reflects whether a country's productive base is being preserved or eroded, even in the face of price volatility driven by scarcity.
Key Advantages of the Revised Methodology
By accounting for both physical changes in asset stocks and shifts in their relative monetary value, the Törnqvist index provides a more nuanced and accurate view of wealth dynamics. It allows policymakers to better understand not just whether asset stocks are expanding, but how their role in national wealth is evolving over time. This leads to a clearer and more policy-relevant picture of long-term sustainability, especially for countries reliant on natural capital or vulnerable to commodity price swings.
As a result, the advantage of the current approach is that it allows to better capture:
- changes in relative volumes due to the degradation or accumulation of assets,
- changes in relative prices due to changes in productivity, or changes in relative scarcity, and
- changing substitution patterns over time through cross-price and cross-volume effects.
Accounting for changes in substitution patterns, as the Törnqvist volume index does, is fundamental to the analysis of sustainability, as substitution opportunities will change over time with changes in the relative scarcity of assets.
This innovation enables policymakers to:
- Track real asset accumulation or depletion over time.
- Evaluate the long-term sustainability of development pathways.
- Strengthen the foundation for evidence-based policy and SDG monitoring.
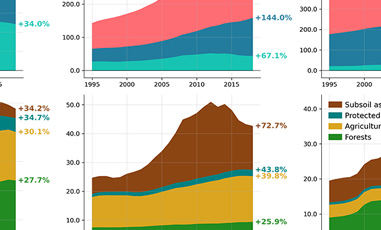
Visualizing Real versus Nominal Wealth
Figure 1 shows that nominal wealth per capita is more volatile, influenced by short-term price fluctuations, which can distort the view of wealth growth or loss. In contrast, Real Wealth per capita, adjusted for inflation and changes in asset volumes, shows a more stable and reliable representation of long-term wealth trends.
A Foundation for Smarter Policy
CWON equips policymakers, researchers, and development practitioners with a more accurate, asset-based lens on economic progress. Its integration with the World Bank's ESG data offers unprecedented potential to link macro trends with sector-specific action.
In Part 2 of this story, we explore a real-world application of this joint data approach—focusing on natural capital decline in Sub-Saharan Africa.