This article is part of a series on integrating the value of nature in economic and financial decision making. It is targeted to data users looking for technical guidance on how to use these datasets and tools. In this second part, we illustrate how the 2024 Changing Wealth of Nations data can be complemented with ESG data and analyzed with the tools available on the Sovereign ESG Data Portal. In Part 1 we explored the foundational insights provided by CWON 2024 and emphasized its role in tracking economic progress. In this post, we present two short case studies on Sub-Saharan Africa: the first on energy access and hydropower, and the second on multi-indicator scoring. Like the Sovereign ESG Data Portal, the Changing Wealth of Nations is supported by the Global Program on Sustainability , which promotes the use of high-quality data and analysis on natural capital, ecosystem services and sustainability to better inform decisions made by governments, the private sector, and financial institutions.
CWON - Framing the big picture of wealth and sustainability
Sub-Saharan Africa (SSF) is a region rich in natural resources yet facing significant sustainability challenges. As the population grows and development accelerates, maintaining the natural capital base is critical for ensuring long-term prosperity. CWON data provides a unique lens to assess whether this base is expanding or eroding over time. The following visualization highlights a concerning trend in the region's natural wealth.
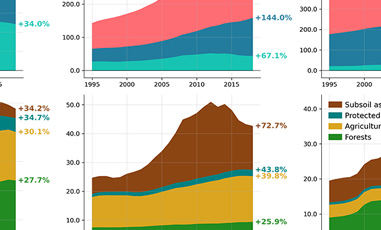
CWON wealth per capita estimates show that while produced capital and human capital in Sub-Saharan Africa increased by 18 percent and 31 percent respectively between 1995-2020, renewable and nonrenewable natural capital declined by 42 and 61 percent respectively. Total wealth per capita in the region increased by 20 percent during this period, but population growth continues to outpace the region's ability to regenerate natural capital. Hydropower is the only renewable asset to show consistent growth, reflecting increased investments in water-based energy infrastructure across the region. Understanding these shifts is critical for designing sustainable development strategies that respond to mounting ecological and demographic pressures. By integrating CWON wealth data with ESG indicators, we gain deeper insights into the factors driving these changes, providing a more comprehensive framework to inform long-term policy and investment decisions.
Interactive ESG data tools – exploring the details behind the trends
Case Study 1: Quadrant Analysis
The quadrant analysis tool on the ESG data portal is an interactive scatterplot that visualizes the relationship between two indicators—such as hydropower wealth per capita and electricity access—allowing users to identify patterns, outliers, and potential policy priorities across countries and regions. When used alongside CWON wealth estimates, the tool helps assess whether Sub-Saharan African countries with greater renewable wealth, like hydropower, are effectively converting that resource into improved infrastructure and energy access.
The figure on hydropower wealth per capita and access to electricity shows a positive correlation across Sub-Saharan African countries, where countries with greater natural capital from hydropower have higher electricity access. However, the visualization also highlights outliers, countries situated in the top-left quadrant (high hydropower wealth, low electricity access) may indicate untapped potential or infrastructural bottlenecks that prevent natural capital from being translated into service delivery. Meanwhile, countries in the bottom-right quadrant (low hydropower wealth, high electricity access) may suggest heavy reliance on alternative energy sources, pointing to different investment and policy strategies.
This tool complements CWON's broader macroeconomic perspective by enabling micro-level exploration of how specific natural assets, like hydropower, are – or are not – contributing to development outcomes. Policymakers can use this to target reforms that close the gap between resource endowments and service delivery, ensuring that natural capital translates into tangible benefits.
Open this view in the portal.Case Study 2: ESG Score Builder
The ESG Score Builder is an interactive tool that enables users to create composite indices by selecting and weighting multiple indicators. This allows users to build an index based on CWON wealth estimates and, if desired, complement it with ESG variables such as energy access or tree cover loss. By combining environmental and socioeconomic data into a single country-level score, the tool offers a broader lens for assessing sustainability. When used with CWON data, the Score Builder can reveal how countries perform across different asset categories—such as renewable natural capital, forest wealth, or human capital—while integrating external ESG indicators to provide additional context.
CWON's wealth estimates are based on the Törnqvist index, which tracks changes in physical volumes weighted by their value shares; thus, they cannot be simply summed across subcomponents. The Score Builder offers a valuable complement, allowing users to generate their own composite scores that combine multiple indicators into a unified view. This flexibility supports exploratory analysis, comparative assessments, and more integrated approaches to understanding wealth and sustainability across countries.
In the graph below, for example, the ESG Score Builder is used to construct a composite index based on natural capital from renewable and non-renewable sources for several Sub-Saharan African countries. The CWON data is complemented with data related to environmental performance from other datasets: forest cover and tree cover losses, renewable electricity and fossil fuel consumption and air pollution. The score builder also allows the user to specify whether an increase in the specific indicator should be interpreted as good or bad. The analysis shows that across all countries, the composite environmental index has decreased since 1990. The index is standardized using the Min-Max normalization, where each country's highest value over time is set to 1 (often in 1990) and its lowest to 0 (often in 2020), allowing clear visual comparison across countries and time.
Step 1: Select indicators for index
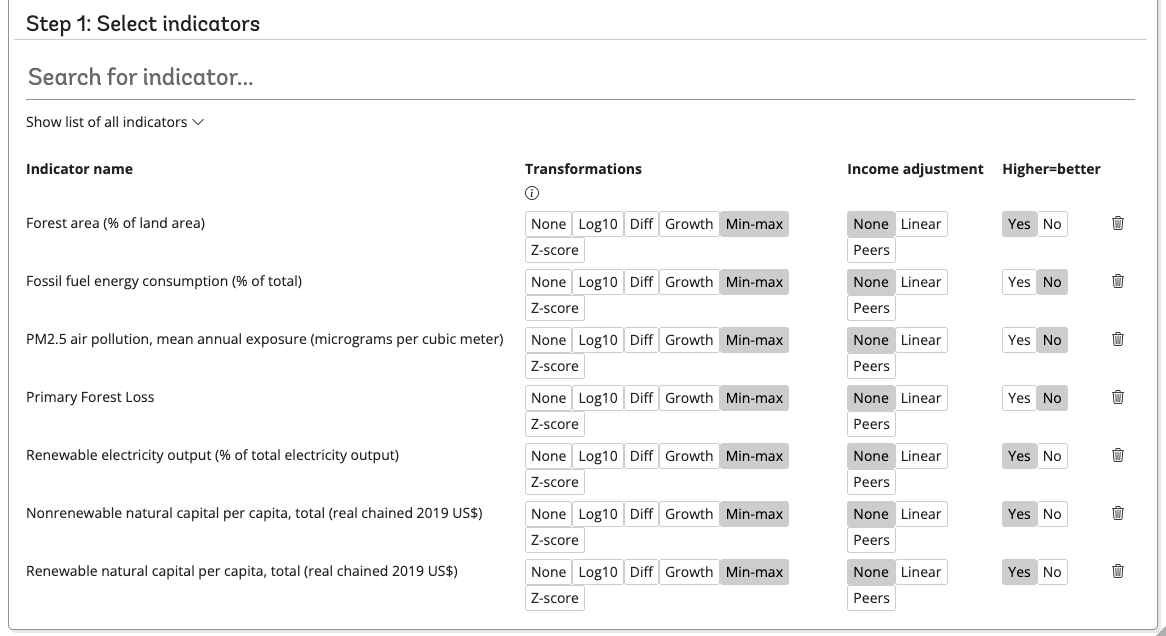
To build your own index with the ESG Score Builder, start by selecting the relevant indicators from the drop-down menu or search bar. For each indicator, you can specify if the data should be transformed, adjusted for the countries income-level. By default, higher values are considered better, to change this, for example for primary forest loss, you can toggle the "Higher=better - No" option.
Step 2: Select economies for index
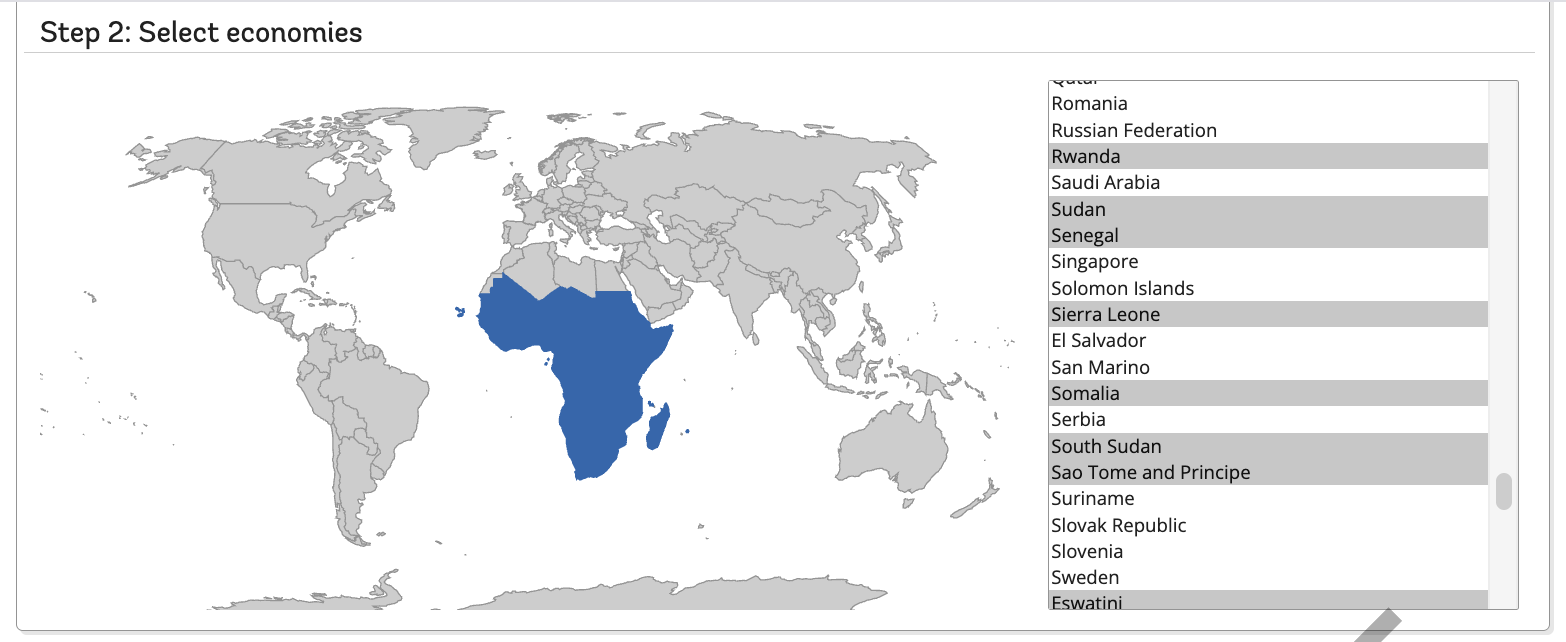
In the next step you choose the countries that should be included in the index. You can select them from the map or the list.
Step 3: Select aggregation method
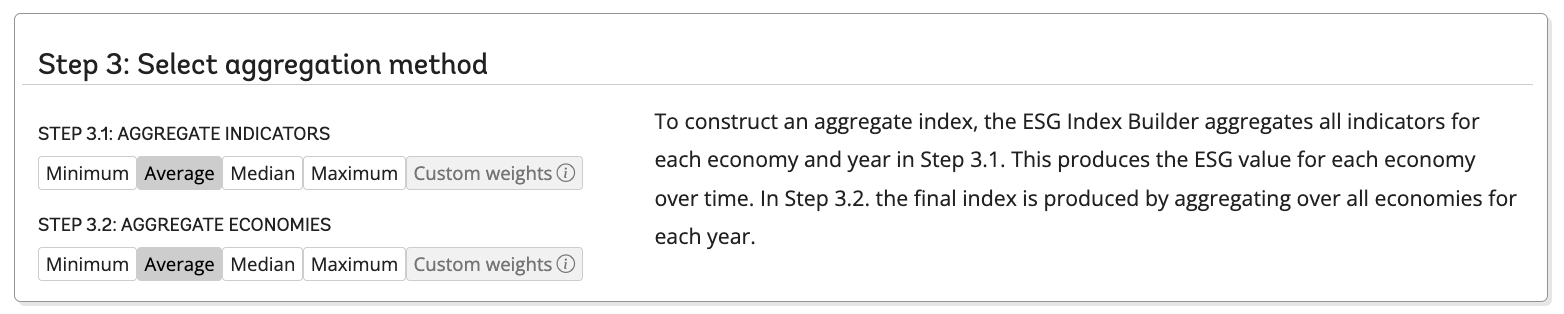
Choose how to aggregate the different components into one index. Average is the default and often a reasonable starting point.
ESG Score Builder Results
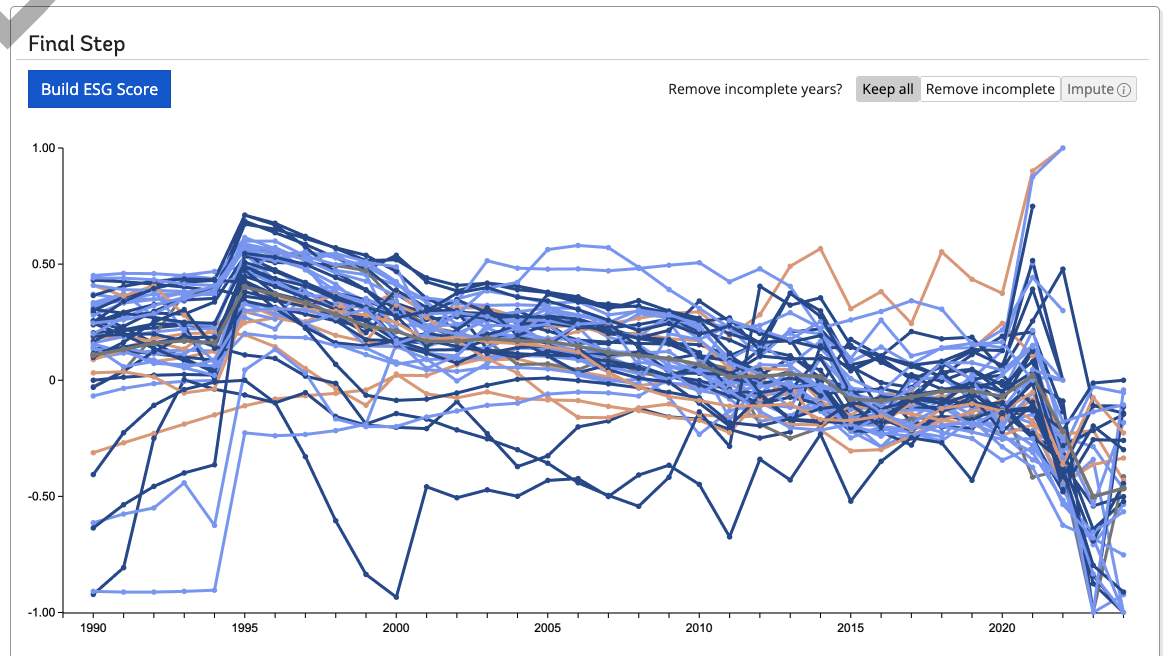
The final graph shows the development of the index over time, for each of the included countries. In the interactive version on the website, you can hover over the lines to select a specific country.
By enabling the integration of CWON wealth indicators and ESG metrics, the Score Builder allows users to explore tailored sustainability profiles. This user-defined flexibility creates opportunities to uncover synergies and trade-offs between environmental assets and development outcomes—empowering more informed, evidence-based decision-making.
Where to explore the data
To explore these insights and more, users can visit the Natural Capital Data Hub . The site offers interactive tools, downloadable datasets, and methodological documentation, making it easy to access, visualize, and use the data for research and policy. The latest updated data for CWON 2024 is available in the CWON country tools excel file accessible through the Natural Capital Data Hub. The CWON indicators are also accessible via the indicators view in the Sovereign ESG Data Portal.
Why this matters: Linking macro and micro data for actionable insights
CWON 2024 offers a comprehensive view of wealth accumulation and depletion across countries and asset types. There is great value in combining this macro lens with ESG indicators. ESG data tools—like the quadrant analysis and score builder – allowing users to unpack CWON trends, identify where intervention is needed, and compare performance across peer countries. Together, these resources empower policymakers, researchers, and development practitioners to diagnose sustainability risks and shape data-driven responses. With rising environmental and social pressures, leveraging these complementary data systems is not just helpful; it is essential.